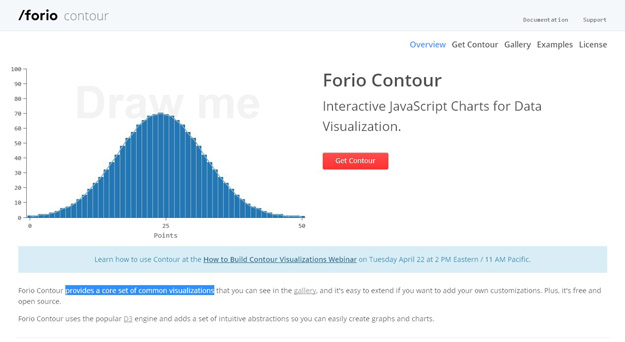
Contour is Forio’s visualization library provides a core set of common visualizations. Built on top of the popular D3 engine, Contour lets you create data visualizations easily, based on intuitive abstractions commonly used in charts and graphs.
The core Contour object defines functionality, visualizations, and default configuration options that can be used by any instance of Contour. Forio Contour is offered free and open source under the Apache v2 license.
[button color=”blue” size=”medium” link=”http://forio.com/contour/” target=”blank” rel=”nofollow” ]Contour[/button]


