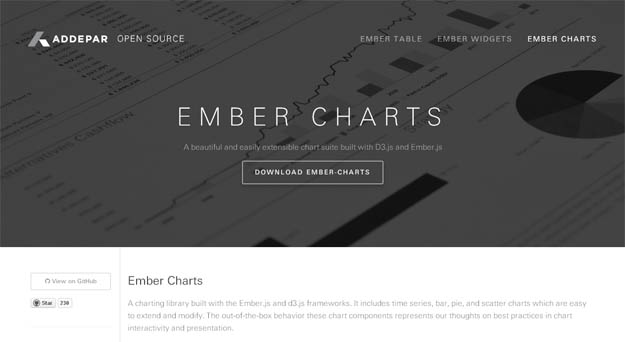
Ember Chart is a charting library built with the Ember.js and d3.js frameworks. It includes time series, bar, pie, and scatter charts which are easy to extend and modify. The out-of-the-box behavior these chart components represents our thoughts on best practices in chart interactivity and presentation.
It provides myriad of features and highly customizable . You can add legends, labels, tooltips, and mouseover effects. You can also roll your own charts by extending our ChartComponent class – get labels, automatic resizing, and reasonable defaults for margins, padding, etc.
[button color=”black” size=”medium” link=”http://addepar.github.io/#/ember-charts/overview” target=”blank” ]Ember Charts[/button]

